
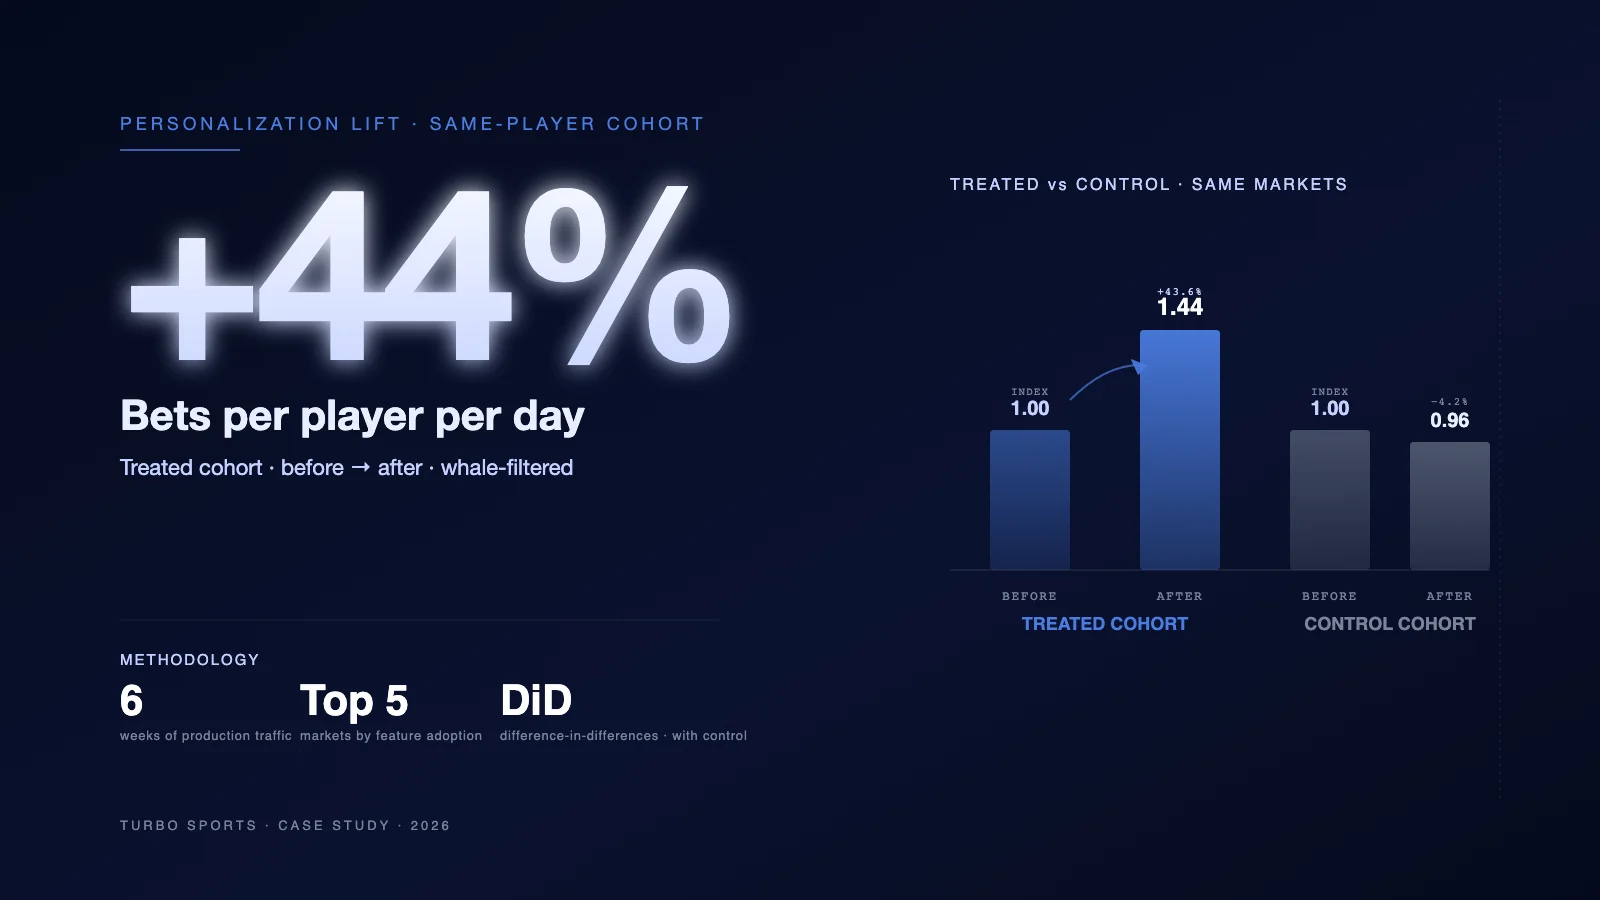
Most sportsbooks surface the same events to most of the audience. Turbo Sports replaces that broadcast with a per-player relevance feed: each user sees events selected from a large pool of behavioural, contextual and pricing signals. Measured against a same-player before/after cohort with a difference-in-differences control, the feed lifted bets and turnover per player per day materially, while the control cohort in the same markets lost a large share of its revenue per player to seasonality over the same window. Revenue per player stayed effectively flat inside the treated cohort — meaning the feature defended revenue against a falling market. No cannibalisation of the rest of the book. Per publication policy, exact percentages are shared with prospective operators together with the methodology, not published.
This case study describes a personalization feature deployed inside the Turbo Sports sportsbook and measured across production traffic on multiple operator brands. All observations are relative — per-player-per-day movements and differences between treated and control cohorts — and are reported here qualitatively. The methodology is designed to be reproducible on any operator's own data: the point of the study is the shape of the lift, not the size of one brand's book.
The broadcast problem
A default sportsbook home screen is a broadcast: the same "top events" carousel, the same "popular now" strip, the same headline markets ordered by editorial priority and open volume. It optimises for the median bettor. For a large share of the audience the median bettor is a stranger — a Dota 2 player sees a Champions League tile, a low-league volleyball follower sees a tennis grand slam, a live-only bettor sees a pre-match rail. The catalogue is fine; the surface is wrong.
The alternative is not "more events" — it is fewer events per player, chosen against a per-player signal. That reframing is the entire scope of the feature described below.
What the feature actually does
The justForYou module on Turbo Sports scores each candidate event for each active player against a pool of characteristics, then renders a per-user event feed in place of a shared carousel. Signals include:
- Behavioural — sports, leagues, teams and market types the player has previously bet on; average stake band; live vs pre-match preference; typical session length.
- Pricing & liquidity — event depth, volatility of the line, whether the price has moved toward the player's historical side.
- Contextual — locale, device, time-of-day, in-play state, and whether the player is inside an active bonus wager cycle.
- Portfolio balance — enough variety that the feed does not collapse into a single-sport echo; new events with a matching signal are seeded even if the player has not bet on them before.
The output is not a "recommended bet". It is a shortlist of events considered relevant enough to occupy the surface real estate the broadcast carousel used to hold. The player still chooses the market, the odds and the stake.
Headline result — cohort before/after with a control
The clean read is the same-player cohort in the top markets by feature adoption. The same players are observed in both windows, so the numbers are not moved by new-player mix; the observation window is normalised per player per day, so weekend and weekday density is neutralised.
Three movements define the result. Bets per player per day rose materially in the treated cohort while the matched control slipped. Turnover per player per day rose while the control fell sharply with the market. And revenue per player per day held effectively flat in the treated cohort while the control lost a large share of the same metric to seasonality and market softness. A treated cohort that stays flat while its control declines steeply is a defensive result priced in the currency an operator actually cares about — the margin per bet compressed slightly inside the treated cohort, because players placed more and larger bets, but volume expansion kept revenue whole.
Segment cut: what changed underneath the headline
The aggregate movement hides segments moving in different directions. Splitting by acquisition cohort clarifies where the feature is doing which job.
| Segment | What the segment showed |
|---|---|
| Existing players (pre-launch base) | The majority of feature stake at roughly platform-normal margin — this is the defence line in the headline result. |
| Players acquired during roll-out | The smallest share of stake at margin materially above platform-normal: new players landing directly into a personalized surface convert to bets faster than new players landing on a broadcast home. |
| Recently activated (weeks before launch) | A middle share, slightly above platform-normal — players still forming a habit benefit most from a feed that answers "what do I bet on today?" |
Segment shares and margins are stated relative to the platform's non-feature baseline over the same window, whale-filtered where noted, and reported qualitatively to preserve operator confidentiality; the shape of the segmentation is the point of the read.
A second cut worth doing is by ticket type: ordinary (single) bets carry the platform-normal margin band, while express legs selected from the personalized feed carry a much thinner one. This is expected — accumulators dilute individual selection margin — but it is worth calling out for anyone reading the aggregate: the ordinary bets are where the feature earns its keep, and any operator adopting a similar surface should split reporting on that axis from day one.
The sport mix the feature actually serves
A personalization surface is only as good as the catalogue it draws from. In the observed roll-out roughly half of feature bets landed on football, with the remainder fanned across esports, volleyball, tennis and basketball; esports collectively accounted for a substantial share of feature bet rows. The signal is that a per-player feed is not a football amplifier — it fans out into the long tail as soon as the underlying behavioural signal permits, and the esports share in particular would be structurally invisible on a broadcast carousel tuned to the median audience.
No cannibalisation of the rest of the book
The obvious concern with any new surface is that it steals stake from the rest of the sportsbook rather than adding it. The cohort test answers this directly: bets placed outside the personalized feed by the same treated cohort rose in the after window compared to the before window. Feature bets sat in a small share of the treated cohort's total bet volume — the personalized surface is additive, not a redistribution.
That is the right pattern to look for when auditing this kind of feature on any book. If total activity of the treated cohort rises and non-feature activity holds or grows, the surface is doing new work. If total activity holds while feature stake rises, the surface has moved existing stake sideways and needs to be repriced against operating cost.
Methodology — how the read was built
The measurement design matters as much as the feature. The observations above are defensible only because each of the following steps was fixed in advance and applied uniformly:
| Step | What we did | Why it matters |
|---|---|---|
| 1. Same-player cohort | Every metric compares the same players in the before and after windows. Players present in only one window are excluded from the cohort maths. | Removes mix effects — new-player acquisition, dormant reactivation and seasonal churn cannot inflate or deflate the reported lift. |
| 2. Difference-in-differences control | Alongside the treated cohort, a control cohort is constructed from players in the same markets who never received the personalized feed in the after window. | Isolates the feature effect from the underlying market drift. Without a control, "flat revenue per player" reads as failure; with a control that declined steeply, it reads as defence. |
| 3. Per-player-per-day normalisation | Every metric is divided by (active players × active days) inside its window. Never by tickets, never by sessions. | Neutralises differences in window length, day-of-week density and player-count changes between windows. |
| 4. Whale filter | The top slice of players by stake is dropped from both cohorts before the ratios are computed. | A handful of high-value players can swing an average by tens of percent. Removing them makes the lift a claim about the broad player base, not a claim about four accounts. |
| 5. Selection-level margin | Stake and revenue are attributed at the bet-selection level, not at the ticket level. Only settled bets are counted. | An express ticket can contain feature and non-feature legs. Ticket-level attribution would credit the whole stake to the feature. Selection-level attribution matches how margin is actually earned. |
| 6. Tournament window excluded | A major sporting event began during the after window and sharply raised overall traffic. The days from its start to the report date are held out of the DiD comparison. | The tournament amplified both cohorts, so including those days would attribute a shared external lift to the feature. Excluding them keeps the DiD interpretable. |
Every step is reproducible from the operator's own wallet, bet history and CRM tables — no proprietary metric definitions are required. The point of publishing the recipe is that a prospective operator can run the same read on their own data before making a platform decision.
What "personalization" needs from the platform
The results above are not portable to any book by copying a marketing message. They require the platform to expose, in real time:
- Player-level behavioural history joinable to a live event catalogue (not a nightly export).
- Pricing and liquidity signals per event, so the ranker can weight relevance against depth.
- A rendering slot on the home surface owned by the ranker, not by an editorial calendar.
- Reporting that can slice by feature exposure, cohort and ticket type — because if the operator can't run the DiD themselves, they can't govern the feature.
These are platform properties, not campaign properties. If any of the four is missing, the feature falls back to a broadcast with extra latency. That is the reason personalization at this quality tends to live inside the sportsbook stack rather than as a bolted-on module — see the wider Turbo Sports architecture and the platform layer that feeds it.
Reading the result the right way
The single most important takeaway is that the win here is defensive. Personalization did not conjure a revenue spike out of the same catalogue; the sportsbook business does not work that way. What it did was hold a treated cohort's revenue per player against a market that was taking a large share off the same metric elsewhere. On a monthly P&L, "flat while everything else drops" is the shape of the highest-value features an operator ever ships. The volume lift is the mechanism through which the defence is achieved — and it is the movement to check first on any operator considering the feature, because if turnover per player is not moving, the revenue defence will not appear.
The second takeaway is for anyone auditing a personalization vendor: ask for the DiD. Ask for the same-player cohort. Ask for the whale filter and the tournament exclusion. A vendor that reports an uplift without a control is reporting the market, not the feature.
Where this sits in the Turbo Sports roadmap
The personalized events surface is one of several ranker-driven surfaces on the roadmap; the same measurement discipline described above is the standard we hold each of them to before we recommend an operator turn one on. If you want to see the feature running against your own event catalogue, or to compare the DiD read on your book against what you are getting today, the operators page is the right place to start. For the underlying Turbo Sports sportsbook solution and the reporting layer that produces the reads above, see the platform documentation.